
A little analysis can go a long way in informing decision-making. If you knew one or two companies you invested in were increasing in value much faster than others, would you invest more in their follow-on rounds? And if you saw that certain industries were consistently lagging others, would you be careful about future investments there? Would knowing the growth potential of your portfolio and unrealized IRR help you make better investing decisions?
Today, most investors have access to sophisticated analytics capabilities for their public company portfolios. Fidelity, Schwab, eTrade and many other websites allow their customers to analyze stock performance and portfolio allocation in dozens of different ways. Why shouldn’t angel investors be able to do just that for their private company portfolios?
Seraf has always provided portfolio management tools for angel investors. But we realize having your angel portfolio organized is just one part of being a successful angel. Learning from what you have done is the other. To learn requires analysis, and analysis requires tools. Seraf’s latest suite of features, Advanced Analytics, provide insights into diversification, growth opportunities, exit potential, annual statistics and IRR.
Is your portfolio as diverse as it should be? What percent is allocated to follow-on rounds? Which companies have had the most growth? How has your annual investment pace changed over time? What year, sector, or company has produced the most returns? What is your unrealized IRR? Our analysis tools help you answer these questions, and more. Seraf’s charts, tables and graphs provide better understanding of your portfolio today, and where future opportunities may lie.
The Portfolio Analysis section of Seraf is now divided into these four tabs:
Diversification
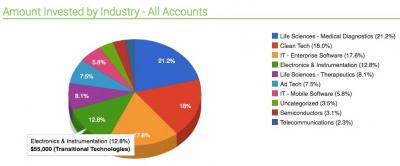
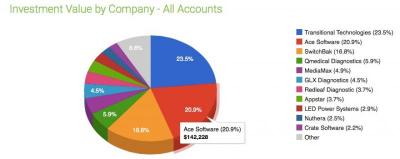
To help you better understand how diverse your portfolio is, you can view amount invested by company or industry, as well as portfolio value by company or industry. Portfolios that start out well balanced by cost basis often grow to become unbalanced over time. These pie charts will clarify which companies and industries are performing best, and aid in future investing decisions.
Portfolio
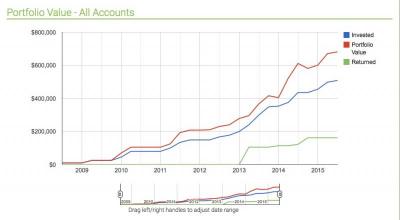
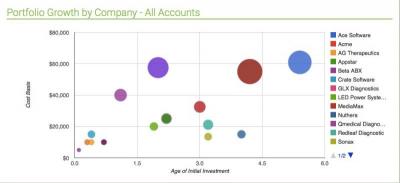
The graphs and tables in this section demonstrate the growth of your portfolio and highlight which companies and years have proven to be the key drivers of overall return. The Investment Valuations table helps you better understand the value of your portfolio today, as well as its potential via your unrealized IRR. Do you know how much you’ve allocated to initial rounds vs. follow-ons? The Investments by Round table helps you determine how much you will need to set aside for future rounds of financing.
Annual Stats
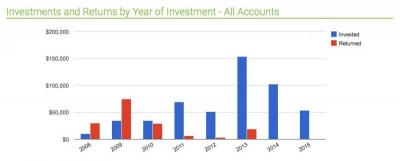
For those interested in learning more about how their investment patterns and returns changed year to year, the first bar chart in this tab shows how much was invested and returned in each calendar year, in aggregate. The next chart gives insight into investments and returns by year of investment (see example below). Think of this chart as a way to understand which years did best, much like a VC is interested in how their different venture funds performed. In an ideal portfolio, the red bar should eventually grow to be taller than the blue bar for each year.
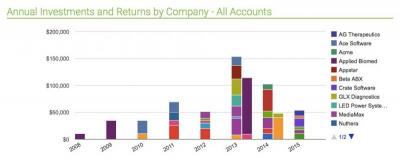
The third bar chart, shown below, has individual investments stacked one on top of the other. This chart shows the same data as the first chart, but gives you a breakdown by company showing investment details as you skim over it. For a slightly different view, you can look at Annual Investments and Returns by Company. Want to know how much you invested each year and how many investments you made? Just hover over any bar to learn more.
Key Metrics
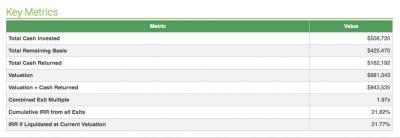
Finally, the Key Metrics tab shows you the big picture - Total Cash Invested, Total Remaining Basis, the Total Cash that’s been returned to you, Valuation, and the sum of your remaining basis plus cash returned. You can also see your Combined Exit Multiple, your Cumulative IRR, and your Potential IRR if your portfolio was liquidated at the current valuation.
Other News
We continue to publish our blog, The Seraf Compass, on a weekly basis, providing insights on all aspects of angel investing and working with entrepreneurs. Interested in getting Seraf delivered to your inbox? Click on the Subscribe button below. We’ve also added several new videos to our large Video Collection, highlighting Seraf’s features and providing quick tutorials on how to use them. As we add more features to Seraf, this is a great place to learn about how to save time and optimize your portfolio.
We know you’re going to appreciate all of these new tools and the peace of mind they bring. Want to learn more? Visit Why Seraf to discover how we can help you organize, track and analyze your portfolio, or check out Pricing to view our three subscription levels. Sign up now and feel good knowing that you are taking control of our portfolio, for yourself, and for your family.
PS: Got a friend who’d be interested in Seraf? Please send them along and we will give both you and your friend a free month on your subscriptions. Have a friend already on the system? Consider sharing deal information to split the work.
Learn more about Seraf Co-Founders Hambleton Lord and Christopher Mirabile and The Seraf Story.