
Note: This article is the sixteenth in an ongoing series on venture fund formation and management. To learn more about managing a fund, download this free eBook today Venture Capital: A Practical Guide or purchase a hard copy desk reference at Amazon.com.
 In Part I of this article, we discussed the two key components of compensation in a venture fund - management fees and carry - and what level of capital commitment LPs expect from GPs. Now let's take a look at historical VC fund metrics, what kind of returns LPs should anticipate from a venture fund, and some ways to improve the rate of return.
What level of investment returns do LPs expect from a venture fund?
Because the risks of investing in startup companies are much greater than the risks of investing in public companies, and the holding periods are long, the fees are significant, and the money is totally tied up and illiquid throughout, VC funds need to outperform the public stock market indices (S&P 500, NASDAQ 100, etc.) by a significant amount to make economic sense. So an annual 10% rate of return for an investor in a VC fund is not enough. LPs are looking for annual return percentages at least in the high teens or low twenties. Or put another way, they are looking for 5-15 percentage points above what the money would have done in a broad-based market index during the same period. And keep in mind that the effective performance threshold is raised by the fact that GPs are taking management fees out as they go along, and also ultimately taking a carry out of any profits. This means GPs have to exceed those levels of return on a gross basis to ensure they meet the performance expectations of the LPs on a net-of-fees-and-carry basis.
Based on detailed research from Cambridge Associates, the top quartile of VC funds have an average annual return ranging from 15% to 27% over the past 10 years, compared to an average of 9.9% S&P 500 return per year for each of those ten years (See the table on Page 13 of the report).
So, if you are an investor in one of these top quartile funds, your returns are better than what you would expect to achieve in the public market indices. However, if you invested in one of the bottom quartile VC funds over the past 10 years, your returns are mostly in the low single digits. You would have been better off in a fund that tracks the S&P 500 (and you would have paid a lot less in fees)! And, not surprisingly, there has been much written about how the average VC fund has underperformed relative to expectations and various benchmarks. This is a hard business and the only thing that keeps the LPs coming back is the promise of outsized returns that might be achieved if they end up in one of the top performing funds.
In addition to analyzing annual rates of return, it’s helpful and common for LPs evaluating VC funds to look at the Distributed to Paid-In (DPI) ratio and the Total Value to Paid-In (TVPI) ratio.
-
The DPI ratio is a calculation of the total amount of capital returned to the investors divided by the amount of capital invested into the fund.
-
The TVPI ratio is a calculation of the total amount of capital returned to the investors along with any remaining value still in the fund divided by the amount of capital invested into the fund.
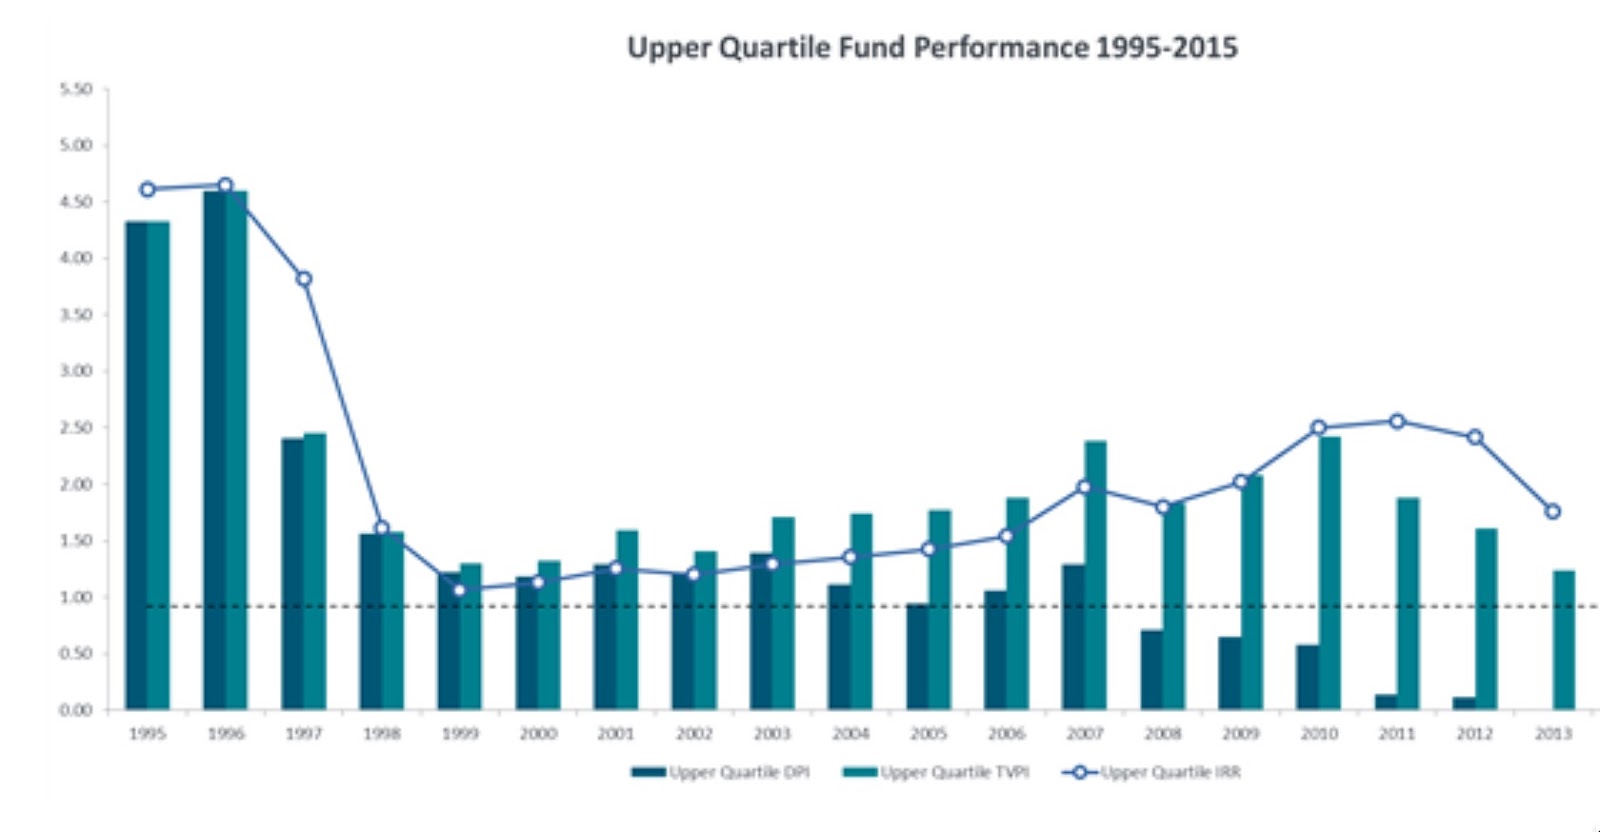
It should be noted, if you want to be a top decile fund, your final DPI ratio needs to be around 3x. In other words, for every 1 dollar invested in a VC fund, there needs to be a return to LPs of 3 dollars over the subsequent 10 year time period. As you can see in the Cambridge Associates chart below, the TVPI ratio (light blue bars), goes as high as 4.5x in the boom years of the Internet bubble and down to 1.5x during the post-bubble years.
Taken together these VC performance indices should give early stage investors a sense of what the professional money managers achieve when working with these startup companies (albeit at a slightly later stage.)
What are some ways to improve the rate of return for the LPs?
As discussed in the question above, the Internal Rate of Return (IRR), also known as the Annual Rate of Return, for a venture fund should be in the 15% to 27% range. There are approaches that GPs can look at to help improve the IRR results for their LPs. To understand how GPs might apply these approaches to their fund, it is important to understand key factors that affect your annual rate of return. Computing your fund’s IRR is all about tracking the timing as well as the inflows and outflows of money. This can be a rather labor-intensive thing to do manually with a spreadsheet, but fund management platforms like Seraf will do this for you automatically, which can greatly speed up and improve the quality of your reporting to LPs. The longer amount of time your fund keeps the LP’s money, the lower the IRR is for the LP.
To understand this concept, let’s use a simple example. Which of the following two investments would you rather have?
1) You get 4X your original investment in 2 years
2) You get 8X your original investment in 6 years
Many would reflexively jump for the 8X. But I would go with investment 1, because I am doubling my money every year. With investment 2, you are doubling your money every 2 years. The time and risk horizon on the second investment is longer, and, of course, so is the opportunity cost you would incur by tying your money up in it. Simple though it is, this example shows you the importance of time when it comes to annual rates of investment returns.
So, if GPs wish to use this approach to improve LP returns, they need to carefully manage the timing and flow of money into the fund. In venture funds, it is common practice to make multiple capital calls during the early years of the fund’s life cycle. Some funds will ask for 33% of the committed capital at the launch of the fund, followed by two additional 33% capital calls during the early years of the fund’s life. That keeps things simple and efficient for the GPs and ensures that cash is readily available when you need to move quickly to make an investment in one of your portfolio companies. However, it’s not an efficient use of your LPs’ capital. In an ideal world, you would only make capital calls for the exact amount of cash you need at the exact time it’s needed. That way, your LPs keep their cash in their own accounts. But that is an extreme and you are going be looking for a balance. By adopting a program of more frequent, smaller capital calls, a venture fund can boost it’s IRR for the LPs by a few percentage points (in exchange for additional fund management work).
Another option for improving fund returns relates to lowering the payout percentage of management fees. This approach to boosting returns won’t work for many GPs because it results in lower income during the early years of the fund. But for those GPs who can afford to forgo near term income, it’s an interesting option.
Here’s an example of how it works:
In our $50M fund example, a 2% management fee will result in $7.5M paid out in management fees. Those fees reduce the amount of capital available for investments to $42.5M because the fees come out of the committed capital. If you want to show your LPs that you have real skin in the game, what better way than to invest those management fees with the fund and thereby boost the actual size of the fund’s holdings while reducing your up-front take home management fee in exchange for more of your upside on the success of the fund! This approach gives the fund more money in the winners to base their calculated returns on, and it shows LPs how confident the GPs are in the fund that they will invest their fees alongside rather than take them up front.
Now let's address some of the costs associated with running a fund, who pays for these organizational expenses, and the total level of compensation a VC can make running an early stage venture fund in Part III of this article.
Want to learn more about managing a fund? Download this free eBook today Venture Capital: A Practical Guide or purchase a hard copy desk reference at Amazon.com.